Multiple Choice
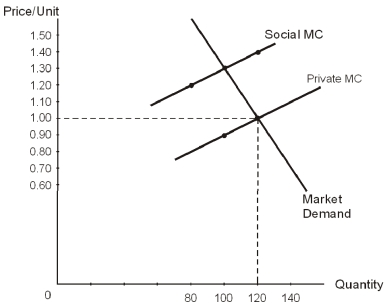
-Refer to the diagram above.The vertical distance between the private MC and the social MC represents
A) excess demand due to prices set too high.
B) excess demand due to prices set too low.
C) the per-unit external cost of production not picked up by the producing firm.
D) the per-unit external cost of production picked up by the consumers.
E) the per-unit external cost of production picked up by the government in the form of taxes.
Correct Answer:

Verified
Correct Answer:
Verified
Q11: Paul owns a home on the top
Q12: The three firms below have five choices
Q13: Which of the following is NOT an
Q14: Ben and Sam are competing for the
Q15: The following data show the relationship between
Q17: If public school education was not free
Q18: Which of the following statements about private
Q19: When there are no externalities,<br>A) the market
Q20: Glen is considering whether to paint his
Q21: Refer to the graph below. <img src="https://d2lvgg3v3hfg70.cloudfront.net/TB3714/.jpg"