Multiple Choice
The following data show the relationship between the number of drivers who leave for work at 8:00 a.m. ,their average commute times,and their marginal benefit associated with the commute times. 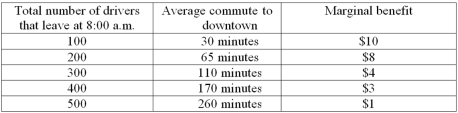
-Refer to the data above.Imposing a toll of $5 if one leaves between 8:00 a.m.and 9:00 a.m.__________ because __________.
A) reduces total economic surplus;citizens are paying for the highway more than once
B) improves total economic surplus;the government now has more tax revenue
C) reduces total economic surplus;drivers do not change their behaviour and pay $5
D) improves total economic surplus;the highway is no longer treated as having a price of zero
E) reduces total economic surplus;the government now has more tax revenue
Correct Answer:

Verified
Correct Answer:
Verified
Q10: <img src="https://d2lvgg3v3hfg70.cloudfront.net/TB3714/.jpg" alt=" -Refer to the
Q11: Paul owns a home on the top
Q12: The three firms below have five choices
Q13: Which of the following is NOT an
Q14: Ben and Sam are competing for the
Q16: <img src="https://d2lvgg3v3hfg70.cloudfront.net/TB3714/.jpg" alt=" -Refer to the
Q17: If public school education was not free
Q18: Which of the following statements about private
Q19: When there are no externalities,<br>A) the market
Q20: Glen is considering whether to paint his