Multiple Choice
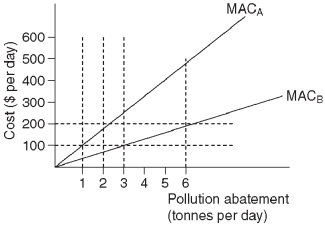 This diagram shows the costs incurred by firm A and firm B as they reduce the pollution from their factories.MACA represents the marginal abatement cost for firm A and MACB represents the marginal abatement cost for firm B.
-Refer to the diagram above.Suppose that the government imposes a tax of $100 per tonne of pollution per day.As a result,firm A will reduce pollution by _______ tonne(s) per day and firm B will reduce pollution by _________ tonne(s) per day.
A) 1;3
B) 3;1
C) 2;6
D) 6;2
E) 3;3
Correct Answer:

Verified
Correct Answer:
Verified
Q43: Suppose that a vaccine is developed for
Q44: Suppose that four land owners,A,B,C,and D,own adjacent
Q45: The following data show the relationship between
Q46: In the case of either an external
Q47: If the marginal cost of pollution abatement
Q49: Assume that the town of Pleasantville has
Q50: The positive correlation between economic success and
Q51: Paul owns a home on the top
Q52: A series of escalating mutually-offsetting investments designed
Q53: Assume that the values in the table