Multiple Choice
The following data show the relationship between the number of drivers who leave for work at 8:00 a.m. ,their average commute times,and their marginal benefit associated with the commute times. 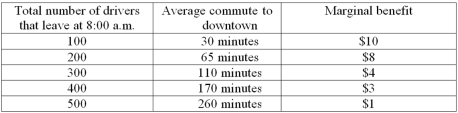
-Refer to the data above.Suppose that a toll is imposed in the following way: leaving between 8:00 a.m.and 9:00 a.m.costs $5 per driver,while after 9:00 a.m.the toll is zero.One can predict that __________ drivers will be on the road between 8:00 a.m.and 9:00 a.m.
A) 100
B) 200
C) 300
D) 400
E) 500
Correct Answer:

Verified
Correct Answer:
Verified
Q40: An environmental activist describes an Environment Canada
Q41: <img src="https://d2lvgg3v3hfg70.cloudfront.net/TB3714/.jpg" alt=" -From the diagram
Q42: When one person's performance is judged relative
Q43: Suppose that a vaccine is developed for
Q44: Suppose that four land owners,A,B,C,and D,own adjacent
Q46: In the case of either an external
Q47: If the marginal cost of pollution abatement
Q48: <img src="https://d2lvgg3v3hfg70.cloudfront.net/TB3714/.jpg" alt=" This diagram shows
Q49: Assume that the town of Pleasantville has
Q50: The positive correlation between economic success and