Multiple Choice
Use the following graph to answer the following questions.
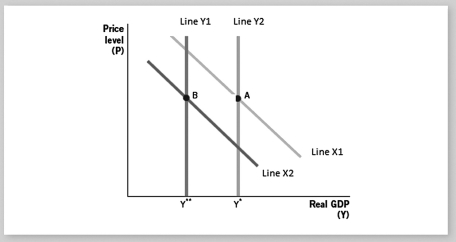
-The difference between lines X1 and X2 represents a(n)
A) aggregate demand change.
B) aggregate demand bubble.
C) long-run aggregate demand bubble.
D) short-run aggregate supply change.
E) long-run aggregate supply change.
Correct Answer:

Verified
Correct Answer:
Verified
Q1: Keynesian economists believe that<br>A) the market tends
Q2: Compare and contrast Keynesian and classical views
Q3: During the Great Depression,aggregate demand in the
Q4: Use the following graph to answer the
Q6: During the Great Recession,the unemployment rate climbed
Q7: The Great Depression,when compared to other economic
Q8: The Great Recession began in<br>A) December 2009.<br>B)
Q9: One of the reasons why the Great
Q10: The Great Recession was similar to most
Q11: Use the following graph to answer the