Multiple Choice
Consider the actual and forecast values contained in the table. 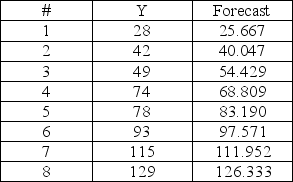 What is the MAPE?
A) 5.92%
B) 6.02%
C) 6.12%
D) 6.22%
Correct Answer:

Verified
Correct Answer:
Verified
Related Questions
Q6: Enrollment in a particular class for the
Q7: For the data below:<br> <img src="https://d2lvgg3v3hfg70.cloudfront.net/TB5481/.jpg" alt="For
Q8: Which of the following is not classified
Q9: The most common quantitative causal model is
Q10: When is the exponential smoothing model equivalent
Q12: Given the following data and seasonal index:<br>
Q13: Use simple exponential smoothing with α =
Q14: In a second order exponential smoothing, a
Q15: Daily demand for newspapers for the last
Q16: Multiple regression models use dummy variables to