Essay
Given the following data and seasonal index:
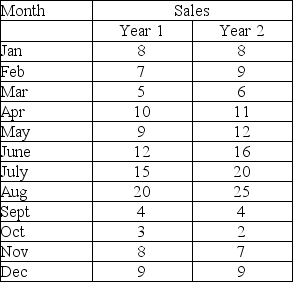 (a)Compute the seasonal index using only year 1 data.
(b)Determine the deseasonalized demand values using year 2 data and year 1's seasonal indices.
(c)Determine the trend line on year 2's deseasonalized data.
(d)Forecast the sales for the first 3 months of year 3, adjusting for seasonality.
Correct Answer:

Verified
(a)and (b)  (c)y = 11.96 + .29...
View Answer
Unlock this answer now
Get Access to more Verified Answers free of charge
Correct Answer:
Verified
View Answer
Unlock this answer now
Get Access to more Verified Answers free of charge
Q7: For the data below:<br> <img src="https://d2lvgg3v3hfg70.cloudfront.net/TB5481/.jpg" alt="For
Q8: Which of the following is not classified
Q9: The most common quantitative causal model is
Q10: When is the exponential smoothing model equivalent
Q11: Consider the actual and forecast values contained
Q13: Use simple exponential smoothing with α =
Q14: In a second order exponential smoothing, a
Q15: Daily demand for newspapers for the last
Q16: Multiple regression models use dummy variables to
Q17: Consider the actual and forecast values contained