Essay
For the data below:
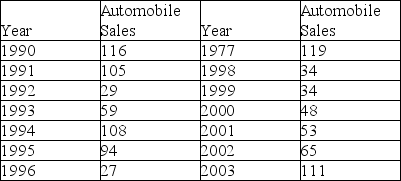 (a)Determine the least squares regression line.
(b)Determine the predicted value for 2004.
(c)Determine the MAD.
(d)Determine the unadjusted forecasting MSE.
Correct Answer:

Verified
(a)  = 85.15 - 1.8X ...
View Answer
Unlock this answer now
Get Access to more Verified Answers free of charge
Correct Answer:
Verified
View Answer
Unlock this answer now
Get Access to more Verified Answers free of charge
Q92: Which of the following methods gives an
Q93: The following table represents the number of
Q94: Consider the actual and forecast values contained
Q95: Assume that you have tried three different
Q96: Consider the actual and forecast values contained
Q98: Mean absolute deviation (MAD)is simply the sum
Q99: A method to measure how well predictions
Q100: Consider the actual and forecast values contained
Q101: A seasonal index must be between -1
Q102: Consider the actual and forecast values contained