Multiple Choice
Consider the actual and forecast values contained in the table. 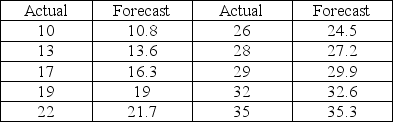 What is the bias of the forecast?
A) 0.01
B) 0.06
C) 0.09
D) 0.13
Correct Answer:

Verified
Correct Answer:
Verified
Related Questions
Q91: The sales force composite method of forecasting
Q92: Which of the following methods gives an
Q93: The following table represents the number of
Q94: Consider the actual and forecast values contained
Q95: Assume that you have tried three different
Q97: For the data below:<br> <img src="https://d2lvgg3v3hfg70.cloudfront.net/TB5481/.jpg" alt="For
Q98: Mean absolute deviation (MAD)is simply the sum
Q99: A method to measure how well predictions
Q100: Consider the actual and forecast values contained
Q101: A seasonal index must be between -1