Multiple Choice
The diagram below illustrates data with a 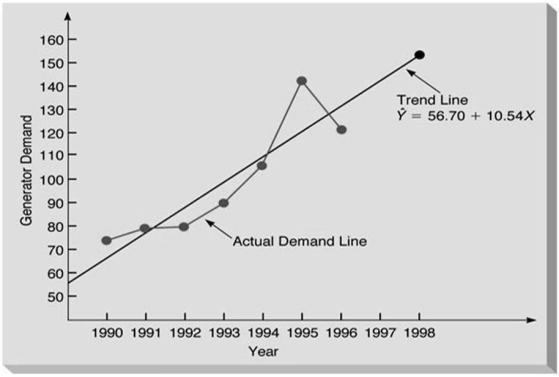
A) negative correlation coefficient.
B) zero correlation coefficient.
C) positive correlation coefficient.
D) correlation coefficient equal to +1.
Correct Answer:

Verified
Correct Answer:
Verified
Related Questions
Q2: A prediction equation for starting salaries (in
Q3: Which of the following is not an
Q4: In the model Y = β<sub>0</sub> +
Q5: The correlation coefficient resulting from a particular
Q6: If multicollinearity exists, then individual interpretation of
Q7: Table 4.1<br>SUMMARY OUTPUT<br> <img src="https://d2lvgg3v3hfg70.cloudfront.net/TB5481/.jpg" alt="Table 4.1
Q8: Which of these equations is a linear
Q9: An air conditioning and heating repair firm
Q10: A variable should be added to the
Q11: In the model Y = β<sub>0</sub> +