Multiple Choice
Table 15-1
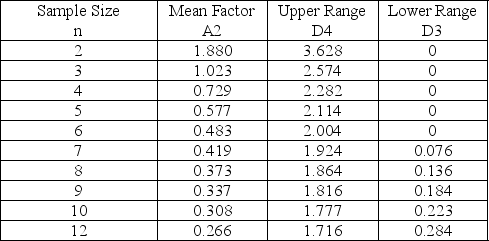
-Refer to Table 15-1.To guarantee that cans of soup are properly filled, some cans are sampled and the amounts measured.The overall average for the samples is 12 ounces.Each sample contains 10 cans.The average range is 0.4 ounces.The upper control chart limit for the sample averages would be
A) 12.1232.
B) 11.8768.
C) 13.2.
D) 12.308.
Correct Answer:

Verified
Correct Answer:
Verified
Q64: Table 15-1<br> <img src="https://d2lvgg3v3hfg70.cloudfront.net/TB5481/.jpg" alt="Table 15-1
Q65: Leo Phan is the new business manager
Q66: The R-chart would be useful when we<br>A)took
Q67: Table 15-1<br> <img src="https://d2lvgg3v3hfg70.cloudfront.net/TB5481/.jpg" alt="Table 15-1
Q68: W.Edwards Deming introduced control charts in the
Q70: Samples sizes of five are often used
Q71: Which of the following statements is false
Q72: A retail store charts the number of
Q73: A coffee company is attempting to make
Q74: Baker studied his control chart and noticed