Multiple Choice
Table 15-1
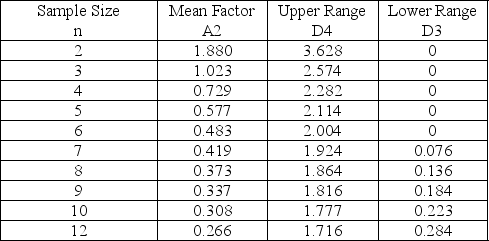
-Refer to Table 15-1.The average range of a process for packaging cereal is 1.1 ounces.If the sample size is 10, find the lower control chart limit for the range chart.
A) 0.245
B) 1.955
C) 1.777
D) 0.223
Correct Answer:

Verified
Correct Answer:
Verified
Q59: Statistical process control uses regression and other
Q60: Table 15-1<br> <img src="https://d2lvgg3v3hfg70.cloudfront.net/TB5481/.jpg" alt="Table 15-1
Q61: The U.S.government awards for quality achievement are
Q62: An airline company tracks the number of
Q63: A p-chart could be used to monitor
Q65: Leo Phan is the new business manager
Q66: The R-chart would be useful when we<br>A)took
Q67: Table 15-1<br> <img src="https://d2lvgg3v3hfg70.cloudfront.net/TB5481/.jpg" alt="Table 15-1
Q68: W.Edwards Deming introduced control charts in the
Q69: Table 15-1<br> <img src="https://d2lvgg3v3hfg70.cloudfront.net/TB5481/.jpg" alt="Table 15-1