Multiple Choice
Table 15-1
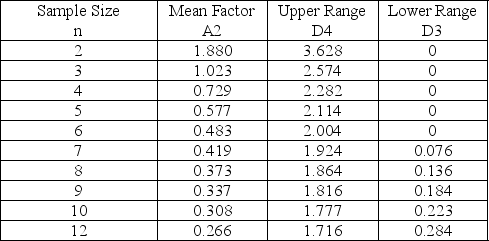
-Refer to Table 15-1.Bags of tea are sampled to ensure proper weight.The overall average for the samples is 8 ounces.Each sample contains 10 bags.The average range is 0.1 ounces.What is the lower limit of the sample averages chart?
A) 7.9692
B) 8.0308
C) 7.9076
D) 8.0924
Correct Answer:

Verified
Correct Answer:
Verified
Q78: A local children's boutique specializes in formal
Q79: Table 15-1<br> <img src="https://d2lvgg3v3hfg70.cloudfront.net/TB5481/.jpg" alt="Table 15-1
Q80: The U.S.government award for quality achievement is
Q81: If we are attempting to control the
Q82: Control charts that are used to monitor
Q84: A p-chart has been developed for a
Q85: The p-chart would be useful when we<br>A)took
Q86: The independent axis of a control chart
Q87: A company has been receiving complaints about
Q88: A professor gives a series of twenty