Multiple Choice
Table 15-1
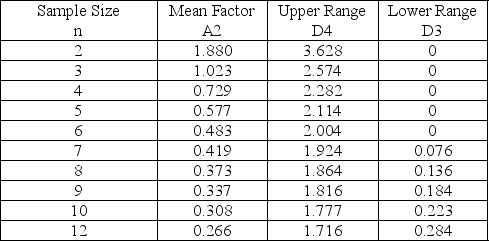
-Use the data shown below and the information in Table 15-1 to develop an upper control limit for a control chart that monitors consistency.What is the upper control limit? 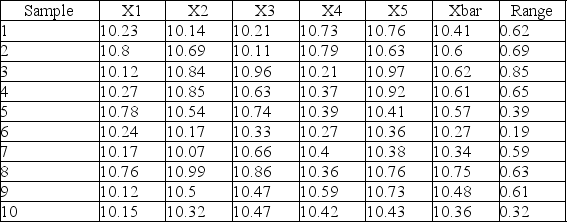
A) 2.11
B) 6.38
C) 10.82
D) 1.17
Correct Answer:

Verified
Correct Answer:
Verified
Q74: Baker studied his control chart and noticed
Q75: A computer diskette manufacturer is concerned that
Q76: A 400-student lecture in introductory statistics conducted
Q77: Table 15-2<br>Given the sample results (100 units
Q78: A local children's boutique specializes in formal
Q80: The U.S.government award for quality achievement is
Q81: If we are attempting to control the
Q82: Control charts that are used to monitor
Q83: Table 15-1<br> <img src="https://d2lvgg3v3hfg70.cloudfront.net/TB5481/.jpg" alt="Table 15-1
Q84: A p-chart has been developed for a