Multiple Choice
Table 15-2
Given the sample results (100 units in each sample) :
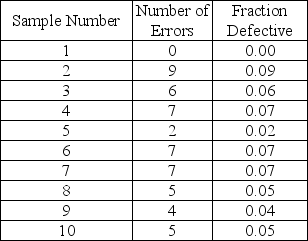
-Based on Table 15-2, find the 95.5% lower limit of the appropriate p-chart.
A) 0.0076
B) 0.0964
C) 0.2014
D) 0.1397
Correct Answer:

Verified
Correct Answer:
Verified
Related Questions
Q72: A retail store charts the number of
Q73: A coffee company is attempting to make
Q74: Baker studied his control chart and noticed
Q75: A computer diskette manufacturer is concerned that
Q76: A 400-student lecture in introductory statistics conducted
Q78: A local children's boutique specializes in formal
Q79: Table 15-1<br> <img src="https://d2lvgg3v3hfg70.cloudfront.net/TB5481/.jpg" alt="Table 15-1
Q80: The U.S.government award for quality achievement is
Q81: If we are attempting to control the
Q82: Control charts that are used to monitor