Multiple Choice
Table 16-1 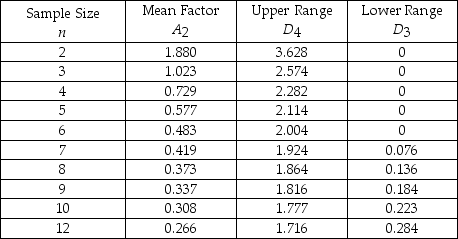
-Refer to Table 16-1. Bags of chocolate candy are sampled to ensure proper weight. The overall average for the samples is 36 ounces. Each sample contains eight bags. The average range is 1.3 ounces. The lower control chart limit for the sample averages would be
A) 36.3730.
B) 36.4849.
C) 35.6270.
D) 35.5150.
E) None of the above
Correct Answer:

Verified
Correct Answer:
Verified
Q41: Leo Phan is the new business manager
Q42: Table 16-1 <img src="https://d2lvgg3v3hfg70.cloudfront.net/TB2951/.jpg" alt="Table 16-1
Q43: Match the following.<br>A) Control limits for an
Q45: Match the following.<br>A) Control limits for an
Q49: A company is producing cylindrical blocks for
Q52: If we are tracking quality of performance
Q59: Statistical process control uses regression and other
Q69: Table 15-2<br>Given the sample results (100 units
Q71: The U.S.government award for quality achievement is
Q72: A retail store charts the number of