Multiple Choice
Table 16-1 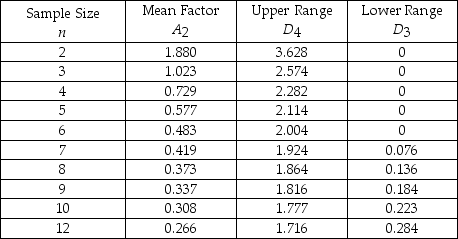
-Refer to Table 16-1. The average range of a process for packaging cereal is 1.1 ounces. If the sample size is 10, find the upper control chart limit for the range chart.
A) 0.245
B) 1.955
C) 1.777
D) 0.223
E) None of the above
Correct Answer:

Verified
Correct Answer:
Verified
Q21: An airline company tracks the number of
Q42: Bags of pretzels are sampled to ensure
Q45: The central limit theorem provides the statistical
Q49: _ are graphs that show upper and
Q52: <img src="https://d2lvgg3v3hfg70.cloudfront.net/TB2951/.jpg" alt=" -charts indicate changes
Q53: Table 16-1 <img src="https://d2lvgg3v3hfg70.cloudfront.net/TB2951/.jpg" alt="Table 16-1
Q55: Match the following.<br>A) Graphical presentation of process
Q60: _ introduced control charts in 1924.
Q73: A coffee company is attempting to make
Q97: If we are attempting to control the