Multiple Choice
Table 16-1 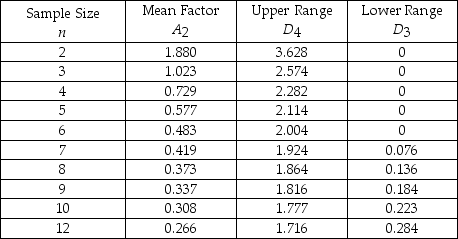
-Refer to Table 16-1. The average range of a process for packaging cereal is 1.1 ounces. If the sample size is 10, find the lower control chart limit for the range chart.
A) 0.245
B) 1.955
C) 1.777
D) 0.223
E) None of the above
Correct Answer:

Verified
Correct Answer:
Verified
Q49: A company is producing cylindrical blocks for
Q52: <img src="https://d2lvgg3v3hfg70.cloudfront.net/TB2951/.jpg" alt=" -charts indicate changes
Q55: Match the following.<br>A) Graphical presentation of process
Q57: Table 16-1 <img src="https://d2lvgg3v3hfg70.cloudfront.net/TB2951/.jpg" alt="Table 16-1
Q60: _ introduced control charts in 1924.
Q69: Table 15-2<br>Given the sample results (100 units
Q71: The U.S.government award for quality achievement is
Q72: A retail store charts the number of
Q73: A coffee company is attempting to make
Q97: If we are attempting to control the