Multiple Choice
Use the data shown below to answer the following question(s) .
Captain Jack Automobiles launched a new car and tabulated the below data for the new launch. 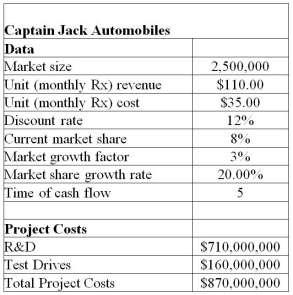 The project manager identified the following distributions and parameters for these variables:
Market size: normal with a mean of 2,000,000 units and a standard deviation of 400,000 units
R&D costs: uniform between $639,000,000 and $781,000,000
Test Drives: lognormal with mean of $160,000,000 and standard deviation $16,000,000
Annual market growth factor: triangular with minimum = 2%,maximum = 6%,and most likely = 3%
Annual market share growth rate: triangular with minimum = 15%,maximum = 25%,and most likely = 20%
Use 5,000 trails to generate the simulation model for NPV using Crystal Ball.
-Using the Tornado Chart tool,determine the assumption that has the least impact on the cumulative net profit for year 1.
A) Market size
B) R&D
C) Test Drives
D) Time of cash flow
Correct Answer:

Verified
Correct Answer:
Verified
Q1: _ is an analytical method that determines
Q2: In the third year,the company is likely
Q4: Explain the Correlation Matrix tool used in
Q5: In Crystal Ball,Latin Hypercube sampling results in
Q6: Explain in brief the functions of Crystal
Q7: How does the Scenario Analysis tool in
Q8: Use the data set shown below to
Q9: Use the data set shown below to
Q10: What is the Batch Fit Tool in
Q11: In the forecast chart for the cumulative