Multiple Choice
TABLE 18-4
A factory supervisor is concerned that the time it takes workers to complete an important production task (measured in seconds) is too erratic and adversely affects expected profits.The supervisor proceeds by randomly sampling 5 individuals per hour for a period of 10 hours.The sample mean and range for each hour are listed below. 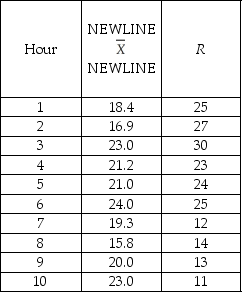 She also decides that lower and upper specification limit for the critical-to-quality variable should be 10 and 30 seconds,respectively.
-Referring to Table 18-4,suppose the supervisor constructs an R chart to see if the variability in collection times is in-control.This R chart is characterized by which of the following?
A) Decreasing trend
B) Increasing trend
C) In-control
D) Individual outliers
Correct Answer:

Verified
Correct Answer:
Verified
Q33: True or False: The purpose of a
Q45: TABLE 18-4 <br> A factory supervisor
Q47: True or False: The control limits are
Q49: TABLE 18-7<br> A supplier of silicone
Q60: TABLE 18-4<br>A factory supervisor is concerned that
Q62: True or False: CPL > 1 implies
Q66: Which of the following is a method
Q73: True or False: Common causes of variation
Q90: TABLE 18-5<br>A manufacturer of computer disks
Q155: Which of the following is not part