Multiple Choice
TABLE 18-4
A factory supervisor is concerned that the time it takes workers to complete an important production task (measured in seconds) is too erratic and adversely affects expected profits.The supervisor proceeds by randomly sampling 5 individuals per hour for a period of 10 hours.The sample mean and range for each hour are listed below. 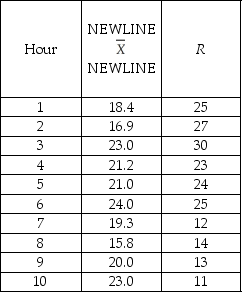 She also decides that lower and upper specification limit for the critical-to-quality variable should be 10 and 30 seconds,respectively.
-Referring to Table 18-4,suppose the sample mean and range data were based on 6 observations per hour instead of 5.How would this change affect the lower and upper control limits of an R chart?
A) LCL would increase; UCL would decrease.
B) LCL would remain the same; UCL would decrease.
C) Both LCL and UCL would remain the same.
D) LCL would decrease; UCL would increase.
Correct Answer:

Verified
Correct Answer:
Verified
Q45: TABLE 18-4 <br> A factory supervisor
Q46: True or False: The R chart is
Q47: True or False: The control limits are
Q55: TABLE 18-4<br>A factory supervisor is concerned that
Q57: TABLE 18-10<br>Below is the number of defective
Q62: True or False: CPL > 1 implies
Q65: TABLE 18-4<br>A factory supervisor is concerned that
Q90: TABLE 18-5<br>A manufacturer of computer disks
Q98: TABLE 18-9<br> The manufacturer of
Q133: Developing operational definitions for each critical-to-quality characteristic