Multiple Choice
TABLE 18-4
A factory supervisor is concerned that the time it takes workers to complete an important production task (measured in seconds) is too erratic and adversely affects expected profits.The supervisor proceeds by randomly sampling 5 individuals per hour for a period of 10 hours.The sample mean and range for each hour are listed below. 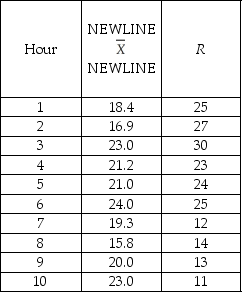 She also decides that lower and upper specification limit for the critical-to-quality variable should be 10 and 30 seconds,respectively.
-Referring to Table 18-4,suppose the supervisor constructs an  chart to see if the process is in-control.What are the lower and upper control limits of this chart?
A) 10.00,30.00
B) 8.49,32.03
C) 5.39,35.13
D) 4.96,35.56
Correct Answer:

Verified
Correct Answer:
Verified
Q6: True or False: The p chart is
Q37: Maintaining the gains that have been made
Q69: TABLE 18-9<br> The manufacturer of cat
Q78: TABLE 18-5 <br>A manufacturer of computer
Q89: Which of the following best measures the
Q121: TABLE 18-8<br>Recently,a university switched to a new
Q123: TABLE 18-2<br>A political pollster randomly selects a
Q125: TABLE 18-4<br>A factory supervisor is concerned that
Q125: Which of the following situations suggests a
Q128: TABLE 18-10<br>Below is the number of defective