True/False
TABLE 2-18
The stem-and-leaf display below shows the result of a survey of 50 students on their satisfaction with their school,with the higher scores representing a higher level of satisfaction. 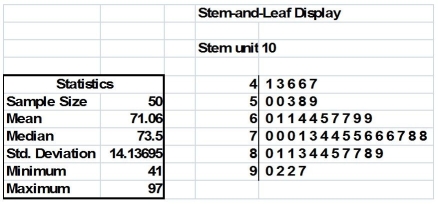
-True or False: Given below is the scatter plot of the market value (thousands$)and profit (thousands$)of 50 U.S.companies.There appears to be a negative relationship between market value and profit. 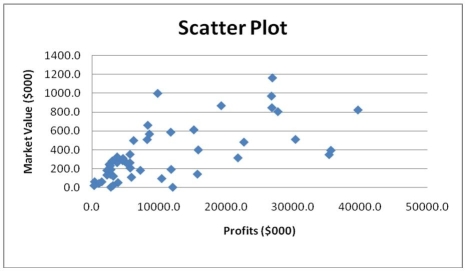
Correct Answer:

Verified
Correct Answer:
Verified
Q17: True or False: A Walmart store in
Q32: True or False: Some business analytics are
Q47: TABLE 2-15<br>The figure below is the ogive
Q50: TABLE 2-13<br>Given below is the stem-and-leaf display
Q56: According to the empirical rule,if the data
Q97: True or False: A histogram can have
Q120: According to the Chebyshev rule, at least
Q141: TABLE 2-18<br>The stem-and-leaf display below shows the
Q148: TABLE 2-14<br>The table below contains the number
Q182: TABLE 2-6<br>A sample of 200 students at