Multiple Choice
TABLE 2-15
The figure below is the ogive for the amount of fat (in grams) for a sample of 36 pizza products where the upper boundaries of the intervals are: 5, 10, 15, 20, 25, and 30.
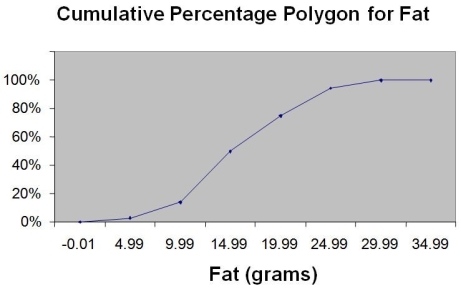
-Referring to Table 2-15, what percentage of pizza products contains between 10 and 25 grams of fat?
A) 14%
B) 44%
C) 62%
D) 81%
Correct Answer:

Verified
Correct Answer:
Verified
Q43: TABLE 2-9<br>The frequency distribution below represents the
Q44: TABLE 2-8<br>The Stem-and-Leaf display represents the number
Q45: TABLE 2-17<br>The following table presents total retail
Q48: Given below is the scatter plot of
Q49: TABLE 2-10<br>The histogram below represents scores achieved
Q50: TABLE 2-13<br>Given below is the stem-and-leaf display
Q51: TABLE 2-13<br>Given below is the stem-and-leaf display
Q104: When constructing charts,the following is plotted at
Q145: The larger the number of observations in
Q161: In order to compare one large set