True/False
TABLE 2-18
The stem-and-leaf display below shows the result of a survey of 50 students on their satisfaction with their school,with the higher scores representing a higher level of satisfaction. 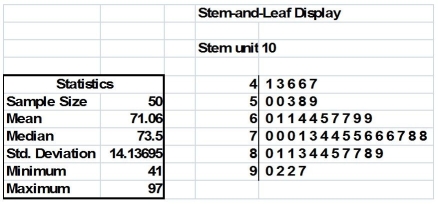
-True or False: The Guidelines for Developing Visualizations recommend avoiding uncommon chart types such as doughnut,radar,cone and pyramid charts.
Correct Answer:

Verified
Correct Answer:
Verified
Q4: TABLE 2-16<br>The figure below is the percentage
Q19: True or False: There is no significant
Q51: True or False: The Guidelines for Developing
Q84: TABLE 2-14<br>The table below contains the number
Q88: True or False: When you work with
Q125: TABLE 2-12<br>The table below contains the opinions
Q126: TABLE 2-18<br>The stem-and-leaf display below shows the
Q168: TABLE 2-9<br>The frequency distribution below represents the
Q169: Which of the following statistics is not
Q171: TABLE 2-18<br>The stem-and-leaf display below shows the