Multiple Choice
TABLE 2-16
The figure below is the percentage polygon for the amount of calories for a sample of 36 pizzas products where the upper limits of the intervals are: 310, 340, 370, 400 and 430.
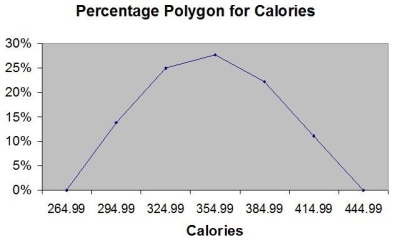
-Referring to Table 2-16, roughly what percentage of pizza products contains between 400 and 430 calories?
A) 0%
B) 11%
C) 89%
D) 100%
Correct Answer:

Verified
Correct Answer:
Verified
Q1: TABLE 2-7<br>The Stem-and-Leaf display below contains data
Q2: To determine the width of class interval,
Q5: TABLE 2-10<br>The histogram below represents scores achieved
Q6: TABLE 2-5<br>The following are the duration in
Q7: TABLE 2-14<br>The table below contains the number
Q8: TABLE 2-16<br>The figure below is the percentage
Q9: TABLE 2-7<br>The Stem-and-Leaf display below contains data
Q10: TABLE 2-7<br>The Stem-and-Leaf display below contains data
Q14: In general,grouped frequency distributions should have between
Q64: When polygons or histograms are constructed,which axis