True/False
TABLE 2-18
The stem-and-leaf display below shows the result of a survey of 50 students on their satisfaction with their school,with the higher scores representing a higher level of satisfaction. 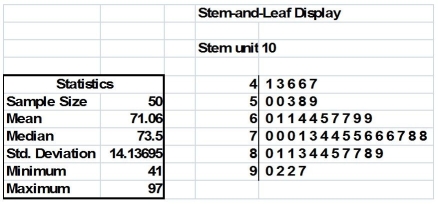
-True or False: Some business analytics involve starting with many variables and are then followed by filtering the data by exploring specific combinations of categorical values or numerical range.In Excel,this approach is mimicked by using a drill-down.
Correct Answer:

Verified
Correct Answer:
Verified
Q19: In a contingency table,the number of rows
Q36: True or False: If you wish to
Q51: TABLE 2-13<br>Given below is the stem-and-leaf display
Q157: Which of the arithmetic mean,median,mode,and geometric mean
Q160: You have collected data on the number
Q163: Which of the following is not a
Q164: TABLE 2-18<br>The stem-and-leaf display below shows the
Q184: TABLE 2-18<br>The stem-and-leaf display below shows the
Q194: TABLE 2-14<br>The table below contains the number
Q202: TABLE 2-10<br>The histogram below represents scores achieved