True/False
TABLE 2-18
The stem-and-leaf display below shows the result of a survey of 50 students on their satisfaction with their school,with the higher scores representing a higher level of satisfaction. 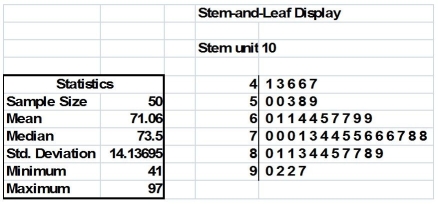
-True or False: Some business analytics involve starting with many variables and are then followed by filtering the data by exploring specific combinations of categorical values or numerical range.
Correct Answer:

Verified
Correct Answer:
Verified
Q4: TABLE 2-16<br>The figure below is the percentage
Q88: True or False: When you work with
Q125: TABLE 2-12<br>The table below contains the opinions
Q159: TABLE 2-18<br>The stem-and-leaf display below shows the
Q160: You have collected data on the number
Q163: Which of the following is not a
Q168: TABLE 2-9<br>The frequency distribution below represents the
Q169: Which of the following statistics is not
Q184: TABLE 2-18<br>The stem-and-leaf display below shows the
Q202: TABLE 2-10<br>The histogram below represents scores achieved