True/False
TABLE 2-18
The stem-and-leaf display below shows the result of a survey of 50 students on their satisfaction with their school,with the higher scores representing a higher level of satisfaction. 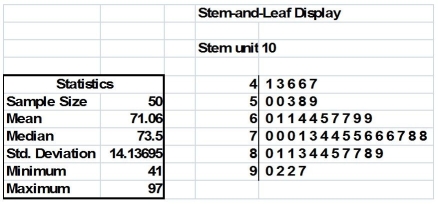
-True or False: Some business analytics involve starting with many variables and are then followed by filtering the data by exploring specific combinations of categorical values or numerical range.In Excel,this approach is mimicked by using a slicer.
Correct Answer:

Verified
Correct Answer:
Verified
Q15: TABLE 2-18<br>The stem-and-leaf display below shows the
Q67: TABLE 2-17<br>The following table presents total retail
Q73: TABLE 2-14<br>The table below contains the number
Q100: True or False: The Guidelines for Developing
Q115: True or False: Percentage polygons are plotted
Q132: TABLE 2-12<br>The table below contains the opinions
Q141: TABLE 2-12<br>The table below contains the opinions
Q152: TABLE 2-10<br>The histogram below represents scores achieved
Q158: TABLE 2-12<br>The table below contains the opinions
Q191: TABLE 2-13<br>Given below is the stem-and-leaf display