Short Answer
TABLE 2-18
The stem-and-leaf display below shows the result of a survey on 50 students on their satisfaction with their school with the higher scores represent higher level of satisfaction.
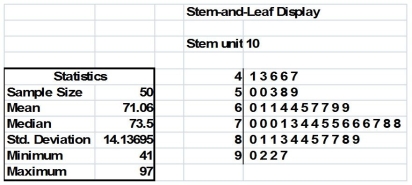
-Referring to Table 2-18, how many students have a satisfaction level in the 50s?
Correct Answer:

Verified
Correct Answer:
Verified
Q10: TABLE 2-7<br>The Stem-and-Leaf display below contains data
Q12: Given below is the scatter plot of
Q13: Apple Computer, Inc. collected information on the
Q14: TABLE 2-9<br>The frequency distribution below represents the
Q14: In general,grouped frequency distributions should have between
Q17: TABLE 2-14<br>The table below contains the number
Q18: TABLE 2-10<br>The histogram below represents scores achieved
Q19: TABLE 2-13<br>Given below is the stem-and-leaf display
Q20: TABLE 2-14<br>The table below contains the number
Q43: The stem-and-leaf display is often superior to