Essay
Assembly Line
Random samples of 200 parts were taken on an assembly line every hour for the past 25 hours.The number of defective parts is shown in the accompanying table. 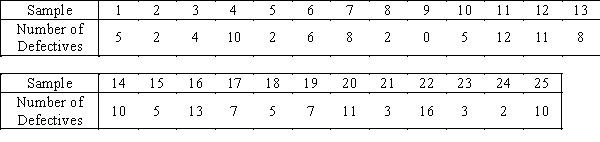
-{Assembly Line Narrative} Construct the p chart.
Correct Answer:

Verified
Correct Answer:
Verified
Related Questions
Q81: The lower and upper control limits of
Q82: Which of the following is NOT something
Q83: The process capability index measures the capability
Q84: 40 Samples Manufacturing <br>The mean of
Q85: 40 samples of size 800 were drawn
Q87: When no point lies outside the control
Q88: A predictable change in operators for the
Q89: 30 Samples Production Thirty samples of size
Q90: A hypothesis test is used to determine
Q91: To determine whether the distribution mean of