True/False
The line chart below shows tomato prices each month from January (month 1)to December last year ($ per pound).By looking at this chart you can see the lowest tomato prices occurred in July. 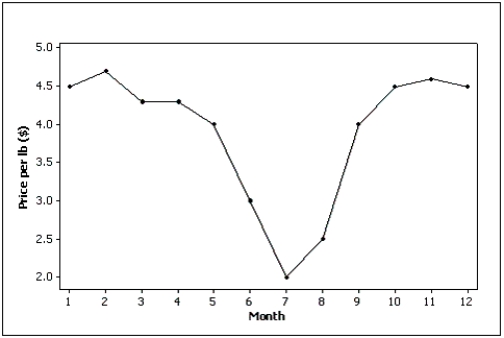
Correct Answer:

Verified
Correct Answer:
Verified
Related Questions
Q32: Internet Classes<br>A survey of 25 students
Q34: The scatter diagram below depicts data with
Q35: Internet Classes<br>A survey of 25 students
Q38: Test scores<br>The scores on a calculus
Q49: If the form of the graph replaces
Q58: Graphical techniques should not be used to
Q90: An individual's income depends somewhat on their
Q128: We determine the approximate width of the
Q138: {Test Grade Narrative} Construct a relative frequency
Q139: The intervals (classes)in a histogram do not