True/False
The scatter diagram below depicts data with a negative linear relationship. 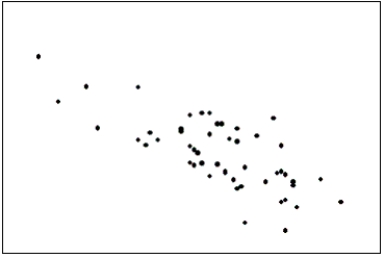
Correct Answer:

Verified
Correct Answer:
Verified
Related Questions
Q30: Data for calories and salt content (milligrams
Q32: Internet Classes<br>A survey of 25 students
Q35: Internet Classes<br>A survey of 25 students
Q37: The line chart below shows tomato prices
Q38: Test scores<br>The scores on a calculus
Q80: Graphical excellence is nearly always univariate.
Q121: When a distribution has more values to
Q128: We determine the approximate width of the
Q138: {Test Grade Narrative} Construct a relative frequency
Q139: The intervals (classes)in a histogram do not