True/False
The line chart below shows cucumber prices fluctuated from $2.00 per pound to over $4.50 per pound during the year. 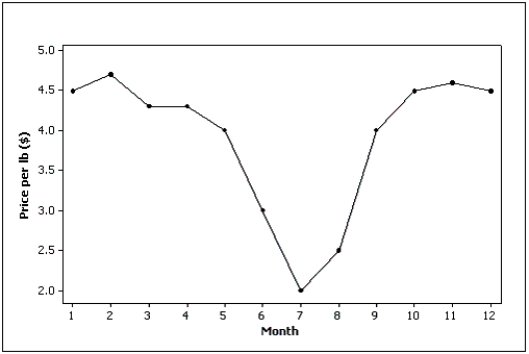
Correct Answer:

Verified
Correct Answer:
Verified
Related Questions
Q89: Which of the following characteristics apply to
Q112: Which of the following statements illustrates graphical
Q136: A line chart is created by plotting
Q138: The advantage of a stem-and-leaf display over
Q145: A(n)_ is a graphical representation of the
Q146: Test scores<br>The scores on a calculus
Q147: Internet Classes<br>A survey of 25 students
Q148: A stem-and-leaf display represents nominal data.
Q150: The intervals (classes)in a histogram are equally
Q154: <img src="https://d2lvgg3v3hfg70.cloudfront.net/TB4388/.jpg" alt=" Admission to ER