Essay
 Admission to ER The following bar chart shows the type of aspirin (if any)given to 100 cardiac patients within 15 minutes of their admission to the emergency room.
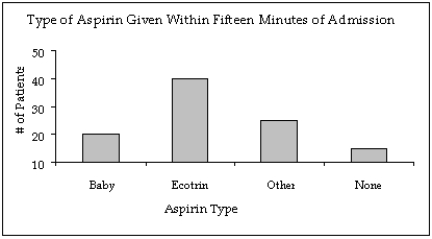
-{Admission to ER Narrative} In what way does the original bar chart distort the data as compared to a bar chart that starts at zero on the Y-axis (frequency axis)?
Correct Answer:

Verified
As read from the original bar chart,the ...View Answer
Unlock this answer now
Get Access to more Verified Answers free of charge
Correct Answer:
Verified
View Answer
Unlock this answer now
Get Access to more Verified Answers free of charge
Q146: If when one variable increases the other
Q147: Data for calories and salt content (milligrams
Q148: A bar chart can be made to
Q149: Insurance Company A representative from a local
Q150: The intervals (classes)in a histogram are equally
Q151: In a histogram a(n)_ class is the
Q152: What type of graph depicts the data
Q153: Which of the following describes the shape
Q155: We create a frequency distribution for interval
Q156: The two most important characteristics revealed by