True/False
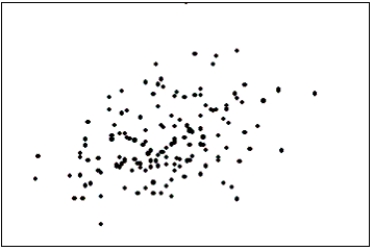
The first scatter diagram below shows a stronger linear relationship than the second scatter diagram.(Assume the scales on both scatter diagrams are the same. ) 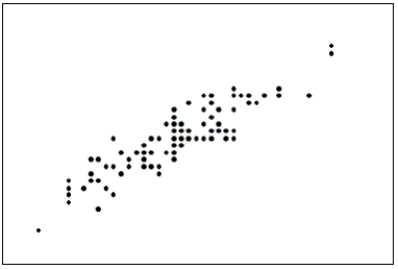
Correct Answer:

Verified
Correct Answer:
Verified
Related Questions
Q34: A pie chart showing 80% yes and
Q59: Graphical excellence gives the greatest number of
Q88: Briefly discuss the difference between cross-sectional data
Q110: Briefly explain the difference between correlation and
Q111: Time-series data are often graphically depicted how?<br>A)Bar
Q114: {Teachers Ages Narrative} Draw a frequency histogram
Q119: Pie charts only show _,not _.This means
Q148: A bar chart can be made to
Q162: The following graph shows pepper prices throughout
Q167: Compare the two histograms below.Which statement is