Essay
Credit Hours The College of Business at The State University of California produced 3,400 credit hours during Spring Semester,2011he number and percentage of credit hours produced by each of the four departments in the College of Business is shown below. 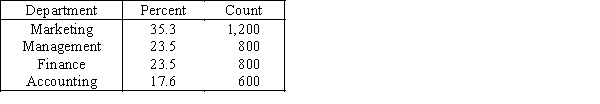 The following three-dimensional pie chart was constructed from the table above.
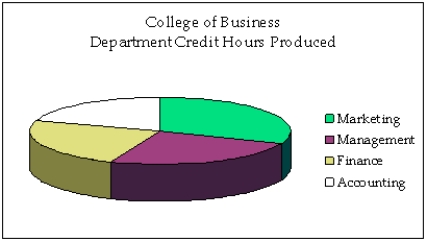
-{Credit Hours Narrative} Construct a two-dimensional pie chart showing the percentages of credit hours produced by the four departments.
Correct Answer:

Verified
The two-di...View Answer
Unlock this answer now
Get Access to more Verified Answers free of charge
Correct Answer:
Verified
View Answer
Unlock this answer now
Get Access to more Verified Answers free of charge
Q60: A(n)_ histogram has two peaks,not necessarily equal
Q61: A histogram is said to be symmetric
Q62: Differences in the frequencies of a histogram
Q63: Which of the following statements about shapes
Q64: A line chart showing the number of
Q66: When one variable increases and the other
Q67: The more observations we have,the _ the
Q68: Which of the following statements is false?<br>A)You
Q69: A histogram represents interval data.
Q70: The line chart below shows tomato prices