True/False
The line chart below shows tomato prices each month from January (month 1)to December last year ($ per pound).By looking at this chart you can see the lowest tomato prices occurred in July. 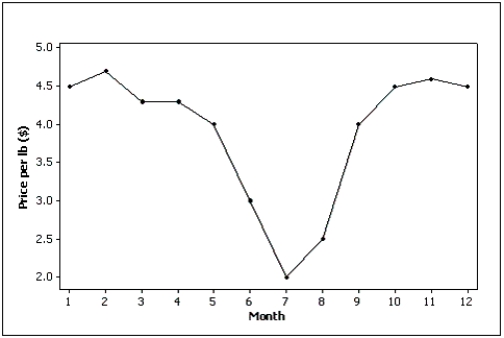
Correct Answer:

Verified
Correct Answer:
Verified
Related Questions
Q65: Credit Hours The College of Business at
Q66: When one variable increases and the other
Q67: The more observations we have,the _ the
Q68: Which of the following statements is false?<br>A)You
Q69: A histogram represents interval data.
Q71: Which of the following statements about histograms
Q72: A popular method of creating distorted impressions
Q73: An economics professor wants to study the
Q74: The graph below represents a line graph.
Q75: The relationship between two interval variables is