Multiple Choice
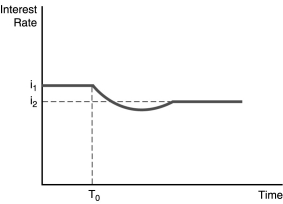
-The figure above illustrates the effect of an increased rate of money supply growth at time period T0.From the figure,one can conclude that the
A) liquidity effect is smaller than the expected inflation effect and interest rates adjust quickly to changes in expected inflation.
B) liquidity effect is larger than the expected inflation effect and interest rates adjust quickly to changes in expected inflation.
C) liquidity effect is larger than the expected inflation effect and interest rates adjust slowly to changes in expected inflation.
D) liquidity effect is smaller than the expected inflation effect and interest rates adjust slowly to changes in expected inflation.
Correct Answer:

Verified
Correct Answer:
Verified
Q5: Everything else held constant,an increase in the
Q11: Use the following figure to nswer the
Q36: Using the liquidity preference framework,show what happens
Q68: If the interest rate on a bond
Q84: When the price of a bond is
Q97: An increase in the expected rate of
Q133: A higher _ means that an asset's
Q139: _ in the money supply creates excess
Q143: When the economy slips into a recession,normally
Q152: When the growth rate of the money