Multiple Choice
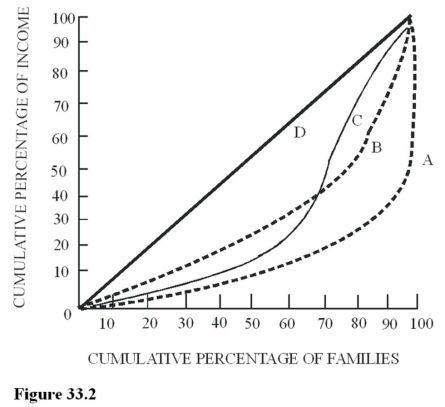 Figure 33.2 illustrates Lorenz curves for four different economies. Which economy should have a Gini coefficient of zero?
A) A.
B) B.
C) C.
D) D.
Correct Answer:

Verified
Correct Answer:
Verified
Q55: The marginal revenue product (MRP)establishes<br>A)An upper limit
Q63: <img src="https://d2lvgg3v3hfg70.cloudfront.net/TB5717/.jpg" alt=" Figure 33.3 illustrates
Q70: If income is distributed equally,the<br>A)Lorenz curve is
Q70: <img src="https://d2lvgg3v3hfg70.cloudfront.net/TB5717/.jpg" alt=" Refer to the
Q91: An increase in deductions,exemptions,and credits in the
Q113: The taxation principle that says people with
Q119: The flat tax was originally proposed by<br>A)Bill
Q126: If the tax elasticity of supply is
Q127: A 7.25 percent sales tax<br>A)Is a proportional
Q136: The Bush tax cuts of 2001-2010 increased