Multiple Choice
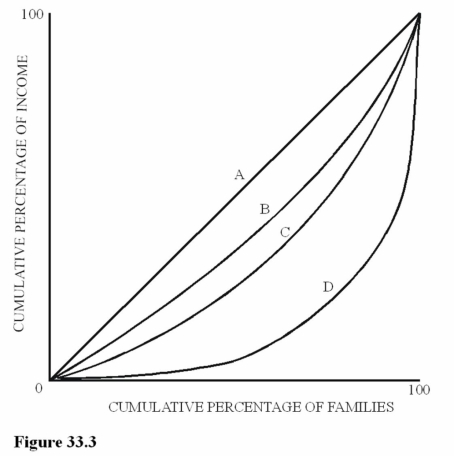 Figure 33.3 illustrates Lorenz curves for four different economies. For which economy would the lowest 20 percent of families receive the smallest share of total income?
A) A.
B) B.
C) C.
D) D.
Correct Answer:

Verified
Correct Answer:
Verified
Q55: The marginal revenue product (MRP)establishes<br>A)An upper limit
Q60: <img src="https://d2lvgg3v3hfg70.cloudfront.net/TB5717/.jpg" alt=" Figure 33.2 illustrates
Q66: <img src="https://d2lvgg3v3hfg70.cloudfront.net/TB5717/.jpg" alt=" Figure 33.2 illustrates
Q70: If income is distributed equally,the<br>A)Lorenz curve is
Q91: An increase in deductions,exemptions,and credits in the
Q113: The taxation principle that says people with
Q119: The flat tax was originally proposed by<br>A)Bill
Q133: Wealth is measured as<br>A)A flow only.<br>B)A stock
Q136: The Bush tax cuts of 2001-2010 increased
Q145: In general,lower marginal tax rates provide incentives