Multiple Choice
Use the figure below to answer the following questions.
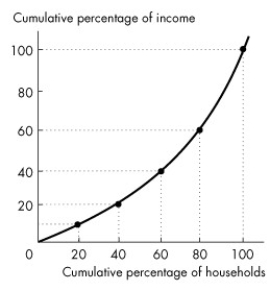
Figure 19.1.3
-The curve in Figure 19.1.3 is the
A) line of fairness.
B) line of equality.
C) learning curve.
D) wage differential curve.
E) Lorenz curve.
Correct Answer:

Verified
Correct Answer:
Verified
Related Questions
Q1: The main reason that wealth inequality persists
Q6: Between 1976 and 2011, the Canadian Gini
Q7: Which diagram is used by economists to
Q8: Use the figure below to answer the
Q9: Use the figure below to answer the
Q12: Household characteristics that stand out when determining
Q13: In 2011, the middle 20 percent of
Q47: The demand for high-skilled labour is derived
Q51: Technological change _ the demand for high-skilled
Q63: Joe earns $100,000 per year.He pays a