Multiple Choice
Use the figure below to answer the following question. 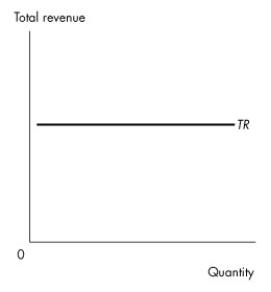 Figure 4.1.3
-Given the relationship shown in Figure 4.1.3 between total revenue from the sale of a good and the quantity of the good sold,then
A) this is an inferior good.
B) this is a normal good.
C) the price elasticity of demand is zero.
D) demand for this good is perfectly elastic.
E) the price elasticity of demand is 1.
Correct Answer:

Verified
Correct Answer:
Verified
Q148: The price elasticity of demand for purses<br>A)is
Q149: The elasticity of supply for airplane travel
Q150: If the price elasticity of demand for
Q151: If the cross elasticity of demand between
Q152: The demand for a good is price
Q154: <img src="https://d2lvgg3v3hfg70.cloudfront.net/TB5272/.jpg" alt=" Figure 4.1.4 -Figure
Q155: When the price of gas is $1.00
Q156: When the price of a good increases
Q157: The elasticity of supply for airplane travel
Q158: Use the figure below to answer the