Multiple Choice
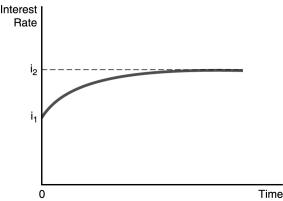
-The figure above illustrates the effect of an increased rate of money supply growth at time period 0. From the figure, one can conclude that the
A) Fisher effect is dominated by the liquidity effect and interest rates adjust slowly to changes in expected inflation.
B) liquidity effect is dominated by the Fisher effect and interest rates adjust slowly to changes in expected inflation.
C) liquidity effect is dominated by the Fisher effect and interest rates adjust quickly to changes in expected inflation.
D) Fisher effect is smaller than the expected inflation effect and interest rates adjust quickly to changes in expected inflation.
Correct Answer:

Verified
Correct Answer:
Verified
Q16: Keynes assumed that money has _ rate
Q18: When the growth rate of the money
Q30: <img src="https://d2lvgg3v3hfg70.cloudfront.net/TB5043/.jpg" alt=" -The figure above
Q37: In the market for money,an interest rate
Q40: The demand curve for bonds has the
Q65: A business cycle expansion increases income,causing money
Q85: <img src="https://d2lvgg3v3hfg70.cloudfront.net/TB5043/.jpg" alt=" -The figure above
Q86: The demand for gold increases,other things equal,when<br>A)the
Q105: If brokerage commissions on stocks fall,everything else
Q165: Discovery of new gold in Alaska will