Multiple Choice
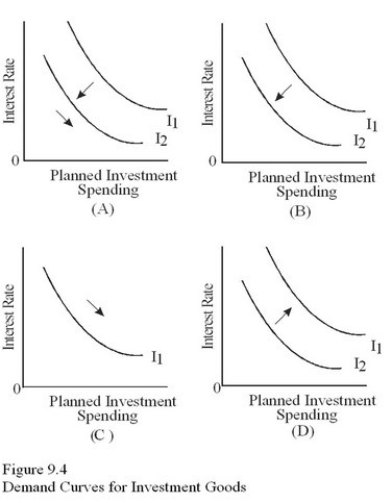 Which diagram in Figure 9.4 shows what happens to investment as the economy enters a recession,causing both business expectations to collapse and saving to increase further,thus causing banks to lower interest rates?
A) A.
B) B.
C) C.
D) D.
Correct Answer:

Verified
Correct Answer:
Verified
Q139: Given the information in Figure 9.7,dissaving would
Q140: According to Keynes,cyclical unemployment is caused by
Q141: Keynes was concerned that at macroeconomic equilibrium
Q142: Suppose the consumption function is C =
Q143: Keynes was concerned that at macroeconomic equilibrium
Q144: The marginal propensity to consume (MPC)is related
Q145: Using Figure 9.9,and assuming the full-employment output
Q146: <img src="https://d2lvgg3v3hfg70.cloudfront.net/TB5720/.jpg" alt=" In Figure 9.5,a
Q147: Suppose the MPC in an economy is
Q149: Which diagram in Figure 9.4 shows what