Multiple Choice
Which diagram in Figure 9.4 shows what happens to investment if the government decides to make housing cheaper by lowering interest rates? 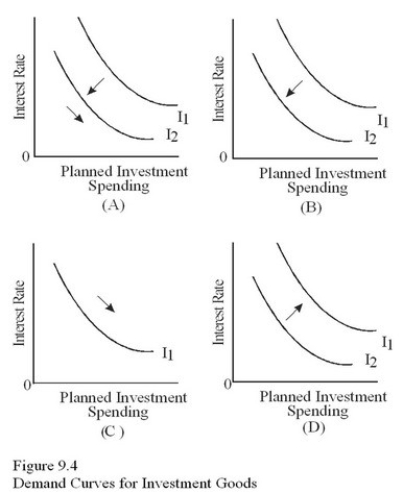 Which diagram in Figure 9.4 shows how investment responds to the expectation that the economy is about to go into a period of fast growth,causing firms to expect increased sales?
A) A.
B) B.
C) C.
D) D.
Correct Answer:

Verified
Correct Answer:
Verified
Q139: Given the information in Figure 9.7,dissaving would
Q140: According to Keynes,cyclical unemployment is caused by
Q141: Keynes was concerned that at macroeconomic equilibrium
Q142: Suppose the consumption function is C =
Q143: Keynes was concerned that at macroeconomic equilibrium
Q144: The marginal propensity to consume (MPC)is related
Q145: Using Figure 9.9,and assuming the full-employment output
Q146: <img src="https://d2lvgg3v3hfg70.cloudfront.net/TB5720/.jpg" alt=" In Figure 9.5,a
Q147: Suppose the MPC in an economy is
Q148: <img src="https://d2lvgg3v3hfg70.cloudfront.net/TB5720/.jpg" alt=" Which diagram in