Multiple Choice
 Using Figure 1.4 and starting at PP1,an increase in the capacity to produce can be represented by a movement from point
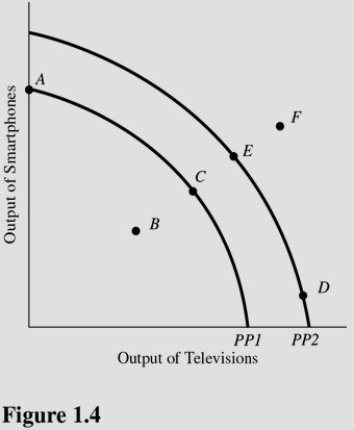
A) A to point B.
B) C to point E.
C) A to point C.
D) D to point E.
Correct Answer:

Verified
Correct Answer:
Verified
Q62: A production possibilities curve indicates the<br>A)Combinations of
Q63: The market mechanism may best be defined
Q64: <img src="https://d2lvgg3v3hfg70.cloudfront.net/TB5720/.jpg" alt=" In Figure 1.9,the
Q65: The production possibilities curve illustrates which two
Q66: Factors of production are<br>A)Scarce in every society.<br>B)Scarce
Q68: <img src="https://d2lvgg3v3hfg70.cloudfront.net/TB5720/.jpg" alt=" Using Figure 1.5,if
Q69: <img src="https://d2lvgg3v3hfg70.cloudfront.net/TB5720/.jpg" alt=" Refer to Figure
Q70: <img src="https://d2lvgg3v3hfg70.cloudfront.net/TB5720/.jpg" alt=" Refer to Figure
Q71: In using a tanks and trucks production
Q72: Table 1.1 shows the hypothetical trade-off