Multiple Choice
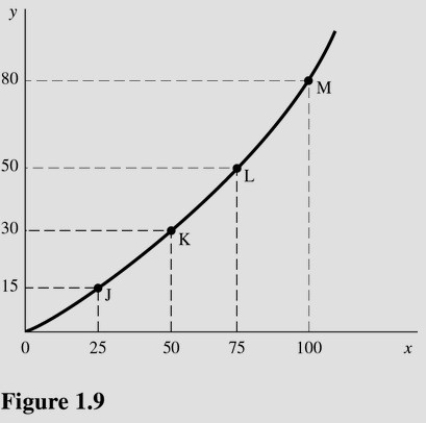 In Figure 1.9,the slope of the line between points L and M is
A) 1.20.
B) 0.80.
C) 0.75.
D) 0.67.
Correct Answer:

Verified
Correct Answer:
Verified
Q59: The opportunity cost of studying for an
Q60: The basic factors of production include<br>A)Land,labor,money,and capital.<br>B)Land,labor,money,and
Q61: If the United States decides to convert
Q62: A production possibilities curve indicates the<br>A)Combinations of
Q63: The market mechanism may best be defined
Q65: The production possibilities curve illustrates which two
Q66: Factors of production are<br>A)Scarce in every society.<br>B)Scarce
Q67: <img src="https://d2lvgg3v3hfg70.cloudfront.net/TB5720/.jpg" alt=" Using Figure 1.4
Q68: <img src="https://d2lvgg3v3hfg70.cloudfront.net/TB5720/.jpg" alt=" Using Figure 1.5,if
Q69: <img src="https://d2lvgg3v3hfg70.cloudfront.net/TB5720/.jpg" alt=" Refer to Figure