Multiple Choice
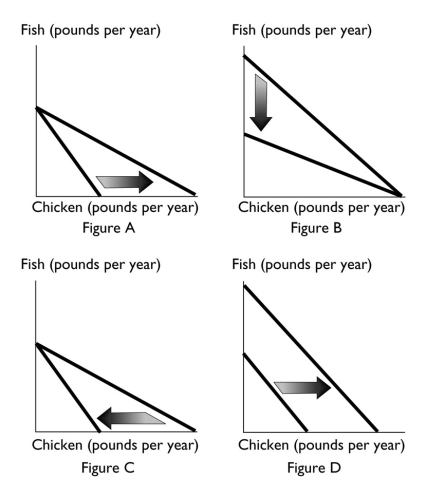
-Which of the above figures reflects an increase in the consumer's budget?
A) Figure A
B) Figure B
C) Figure C
D) Figure D
E) Both Figure A and Figure D
Correct Answer:

Verified
Correct Answer:
Verified
Q278: Suppose Lizzie consumes soda and pizza.If the
Q279: The magnitude of the slope of an
Q280: Goods that are valuable will have a
Q281: Suppose the quantity of burgers is measured
Q282: Bottles of Soda Slices of Pizza<br> <img src="https://d2lvgg3v3hfg70.cloudfront.net/TB1458/.jpg"
Q284: <img src="https://d2lvgg3v3hfg70.cloudfront.net/TB1458/.jpg" alt=" -The figure above
Q285: Marginal utility is the change in total
Q286: The slope of the budget line can
Q288: <img src="https://d2lvgg3v3hfg70.cloudfront.net/TB1458/.jpg" alt=" -The above figure
Q291: <img src="https://d2lvgg3v3hfg70.cloudfront.net/TB5274/.jpg" alt=" -Tom is stranded