Multiple Choice
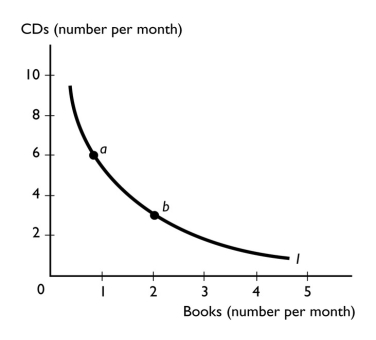
-The above figure shows one of Cheri's indifference curves.Suppose point a represents the best affordable point for Cheri.Cheri's best affordable point could move to point b if
A) marginal utility increases.
B) total utility increases.
C) the price of a CD falls and the price of a book rises.
D) the price of a CD rises and the price of a book falls.
E) Cheri's budget increases.
Correct Answer:

Verified
Correct Answer:
Verified
Q283: <img src="https://d2lvgg3v3hfg70.cloudfront.net/TB1458/.jpg" alt=" -Which of the
Q284: <img src="https://d2lvgg3v3hfg70.cloudfront.net/TB1458/.jpg" alt=" -The figure above
Q285: Marginal utility is the change in total
Q286: The slope of the budget line can
Q289: <img src="https://d2lvgg3v3hfg70.cloudfront.net/TB1458/.jpg" alt=" -Given the data
Q290: <img src="https://d2lvgg3v3hfg70.cloudfront.net/TB1458/.jpg" alt=" -_ leads to
Q291: <img src="https://d2lvgg3v3hfg70.cloudfront.net/TB5274/.jpg" alt=" -Tom is stranded
Q291: Explain why total utility is maximized when
Q292: The benefit that John gets from eating
Q362: "Every point on a demand curve represents